Xyphros electronic workshop
http://www.xyphro.de/blog/index.php
LCR meter - Release of all design files
http://www.xyphro.de/blog/index.php?entry=entry140316-224931
Do you want to have a look how it works internally? ...build your own version of it? ...or extend the functionality?
Now It's your turn!
First of all, here the most important parts of this post:
I spend a lot of my limited time to develop this. I really enjoy if somebody is using, improving it or usings parts to create something completely different. Do whatever you like with it, as long, as the whole project or parts of it are used for non-commercial purposes. Please provide credits.
For commercial use, even if only parts of this is used in indirect or direct form, please contact me.
About the code
The code was developed with IAR for MSP430. It should compile with other toolchains as well, with minimal changes. I did not test it myself yet. The code is structured in different submodules, e.g. pga.h/c to controll the PGA, dac.h/.c to control the DAC, lcd.h/c contains the LCD code, and so on...
Behaviour of the device
After inserting the battery, the device will start a calibration cycle. This calibration will improve the common mode rejection ratio of the differential amplifier, calibrate the gain factors of the PGA, ... Follow the instructions shown on screen. BTW: The calibration constants of my device are the default values. Have a look at main.c for comparison with the constants you will get.
Button
The button has 2 purposes: 1.) turn the device on and off. The device can be turned off by pressing the button long, until the screen turns off. The devices uses the power saving modes of the MSP430 do decrease the current consumption to a minimum. The power supply of LCD and analog components is also turned off, when the device is turned off. 2.) Select between the different measurement frequencies.
Formulas
I've been asked pretty often, how the calculation of the impedance works. Here a PDF showing the formulas, and transformations to get them: Basic_formulas_for_LCR_measurement.pdf
Disclaimer
Don't blame me, if this burns down your hose, hurts your cat, burn your fingers while soldering, ... Use it at your own risk :-)
]]>WinUsbTmc - A simple interface for USBTMC based measurement devices
http://www.xyphro.de/blog/index.php?entry=entry130705-223439
This was a very handy feature and powerful automated measurement setups could be easily built.
Nowadays there are many devices on the market with a USB connector. When you intend to make use of this feature, you will notice that you have to download and install a several hundred MB sized library which includes a driver for such devices. Integrating this library into your own applications can be rather complex depending on your development environment.
Is this really neccesary just to send commands and get a response from your device?
At least I was not happy with this situation.
After doing some research I noticed that these devices implement a certain USB class called USBTMC for which a well described documentation is available.
The communication protocol is very simple and I started to write a small software module with a simple interface to talk to such devices. For this I needed only 2 days of work. I called it WinUsbTmc and published it as Open source project under GitHub:
The current status of the project consists of the following elements: - A UsbTmc driver which can be used with all USBTmc measurement devices - A command line utility to talk to your device from command line or batch file - A Dll. In case you want to integrate UsbTmc communication in your product this is an easy interface to it
and finally a Matlab interface.
WinUsbTmc follows the KISS principle and everybody should be able to start communicating to his device in the matter within a few minutes.
WinUsbTmc was tested succesfully with 3 devices: - Rigol 1052E (Scope) - Rigol DS2072 (Scope) - Siglent SDG1020 (Function generator)
While developing, it was also interesting to see that some devices don't implement the UsbTmc standard completely. E.g. some class functions which are mandatory according to the UsbTmc specification don't work with some devices. Nevertheless, I tried to work around it and could use WinUsbTmc already in a automated test setup.
In case you would like to participate: You are welcome.
Adding interfaces for other tools like Matlab would be a nice thing to have, e.g. Labview, Visual C, Borland Delphi, ...
]]>Current status
http://www.xyphro.de/blog/index.php?entry=entry121227-233617
I promissed to post a short status update of the project...
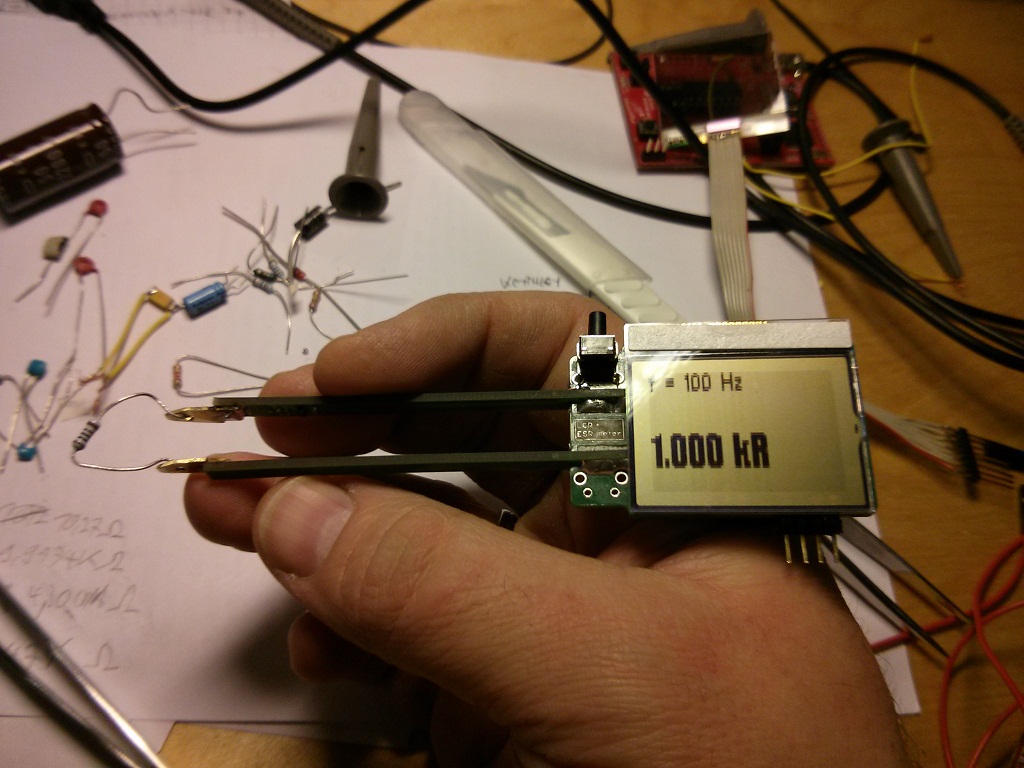
I'm already pretty satisfied with the current results. The measurements are reliable, repeatable and seem to have a good precision compared with my calibrated 6 digit multimeter.
For measurement frequencies of 100Hz and 1kHz I tried successfully components in the range of:
- about 8mA during measurement (including 2mA for the analog stuff) - 20uA when it is turned off (can be improved by changing software, but is already acceptable)
The low current consumption allows the meter to be powered from a single 3V CR2032 battery.
dynamic current measurement / higher test frequencies
The current measurement over the 1K resistor using an opamp based subtractor was not a very good approach. The problem is not the CMRR. Allthough it is not that good (abt. 60dB) I was able to compensate it digitally to over 100dB in my firmware. The main problem is the different delay in the 2 inputs which leads to problems because of the quantization steps of the DAC. I will rewire it to a standard opamp based single supply I to V converter. This change should also allow to allow much higher measurement frequencies (10kHz / 100kHz, maybe even 600kHz with some DSP tricks).
Crosstalk
2 termination resistors were put directly on the inputs of the PGA. This minimizes capacitive crosstalk of the current and voltage signal. This is not extremly important but increases the measurement range in case one of the signals is large and the other one is small (e.g. very small impedances or very large impedances).
MSP430 ADC reference
In first instance I used the internal 2.5V reference of the MSP430. This reference is not stable in my case, as ADC and DAC are running synchronous and the DAC has a very high conversion rate. I could see an oscillation of about +-20 digits in the ADC results. I switched to use the analog supply voltage as reference. This will not decrease the precision, as DAC and ADC use the same reference.
Digital signal processing
The measurement of the phase and amplitudes is based on a DFT rather than an FFT. Only a single frequency bin has to be masured, so an DFT is in this case more efficient as a radix 2/4-FFT which would calculate all frequency bins. The sine-tables which are output to the DAC are precalculated and are also used directly for the DFT calculation which saves memory.
Mechanical construction
The 2 PCB arms work well. They can be bended very easy and I don't have the feeling that they will break after a longer time of use. But: It would be better to increase the length a little bit to be able to read the LCD from a better angle. My current tweezer-tips are not very good but will be replaced later with better ones. ]]>LCR meter - first results
http://www.xyphro.de/blog/index.php?entry=entry121112-233814
Here my first update:
Got the analog part up and running. Unfortunaltely I had to do some "bugfixes" & optimizations... Nevertheless, tests have proven that it supports up to 100 kHz test frequencies.
The low level stuff of the software is also done: - Communication with PGA - UART debug output - LC-Display control, including "printf" - signal generation and synchronous sampling - phase angle and amplitude measurement - automatic setting of PGA according to the input signal amplitude
Measurement results
The readings are raw and uncensored data, i.e. without any compensation of imperfections of the ADC, DAC, PGA and imbalance of current measurement, which will be added in a next step.
The imbalance and non perfections of the current measurement lead to great errors in the phase and amplitude measurement when the current signal is small. The root source is, that both inputs of the subtractor will never be 100% balanced. But the good news is, that this error can be compensated in the digital domain.
When viewing the results, also consider, that a 10K resistor does not have a value of 10K. I double checked for example the 10K resistor which measures as 9950 Ohm with a multimeter.
Interpretation of the display content
Line 1: phase of voltage signal Line 2: amplitude of voltage signal Line 3: phase of current signal Line 4: amplitude of current signal Line 5: phase between voltage and current signal Line 6: resistance in Ohm or capacitance in pF
Here some other measurement results:
Next steps
- Realize different measurement frequencies (currently fixed to 10kHz) - Get more precision - autodetection of equivalent circuit (in this version only R L or C only are supported) - update schematic according to new changes - make a fancy menu system, nicer font, ...
]]>Cheap 'n good LCR meter (or RLC meter?) for SMD components
http://www.xyphro.de/blog/index.php?entry=entry121106-180136
Sometimes it would be handy to measure the values of SMD components.
I thought: I can even build a single piece for 1/10th of the price.
The measuring principle is quite simple and well described in literature. Dave Jones also described it in one of his videos: http://www.youtube.com/watch?v=fs2MfTW4o_Q The description starts at about 03:00.
A sinusodial signal is injected in the device under test and the amplitude and relative phase relation of voltage and current signals are measured to calculate the needed values.
Based on the Phase shift it is possible to detect the kind of device (inductor/resistor/capacitor) while the amplitude relations in conjunction with the frequency are used to calculate the component value.
Apart from only measuring the value and type of device it is also possible to measure for example the ESR of them.
The problem is: To be able to measure very small and very large values it is needed to have a very high dynamic range for current and voltage measurement. After some calculactions I decided to use a programmable gain amplifier (PGA) to scale up the voltages before AD conversion.
I've choosen components to be able to operate at 3V CR2032 con cell: - PGA113 as PGA. It has 2 input channels, so one channel can be used for voltage, the other one for current measurement - Nokia 3210/3310 LC Display. It tested => It can run from a single CR2032 cell - MSP430F5338: The 2 DAC outputs are used to generate a DC offset for the single supply system (virtual ground) and the sinusodial exitation signal. The internal ADC digitizes the signal, which is selected by the PGA. - OPA378 operational amplifiers
Measurement accuracy (!= resolution)
I made some simulations based on the accuracy of the MSP430 DACs and ADCs, and the PGA113. For simplicity I only did this analysis for resistive DUTs.
Closeup look for small values:
+-2% for small values is fair enough. The accuracy can be further improved by calibration. BTW: The simulated results are for non-calibrated systems! The "small value accuracy" can be improved by choosing PGAs with higher gain.
Schematic
(click to zoom in):
For best accuracy I decided to make a few optimizations in the schematic: - to avoid capacitive coupling termination resistors are inserted at some positions - A "4 wire like" approach is used. For this reason an operational amplifier is placed very close to one of the measuring points.
Measurement principle
As the sinusodial signal is generated by the MCU and the MCU is also digitizing the voltage and current signals it they are totally synchronous to each other. For this reason it is possible to measure first the voltage signal and afterwards the current signal. This saves an additional AD converter.
DAC0 will be set to VREF/2 (virtual ground) DAC1 will output the sinusodial signal
The MCU will generate the signal by DMA transfers. A PWM-Timer will be setup to have the same period as the sinusodial signal. The Timer will automatically trigger a single AD conversion per cycle. The duty cycle selects the position. The Duty cycle is changed a few times to digitize the signal at a different position once per sine-cycle.
This measurement principle allows high measurement signal frequencies while keeping the CPU load very low.
This will be done for the voltage and for the current signal.
Afterwards the phase of voltage and current signal has to be measured based on the acquired samples.
Phase and amplitude measurement
The resulting samples will be put in an FFT function which should generate a single peak bin. No FFT leakage will occur as DAC and ADC work synchronous to each other, so it is possible to use an FFT to measure the amplitude and the phase of the signal.
A very small FFT can be used to realize this functionality. Already a FFT of size 4 can be enough. Advantage: FFT of size 4 does not need any complex multiplications.
An FFT over traditional methods has a few other advantages: It acts also as small band filter, so noise in non-interesting frequency bins don't affect the measurement.
PCB
A few days ago my prototype PCBs arrived.
Aren't they beautyful? :-)
I also found a good way to realize the "tweezers". Measurement probes ("nails") are still missing, I will add some later.
For easier development I soldered the display with a long cable to the board. Later a very short cable can be used or the original clamping contacts of the display can be used.
Next steps: - Get circuit up and running, try analog frontends, etc... - Write "some" software :-)
1st update]]>Homemade vortex flow meter
http://www.xyphro.de/blog/index.php?entry=entry121105-220821
Of course I'm interesting to measure efficiency of the system, so I added temperature and humidity sensors to it and even realized a function that it only ventilates when the outside humidity is low enough to avoid condensation at cool walls.
But are the in- and outlet ventilators running at the same flowrate? How big is the pressure drop of the piping and the corresponding reduced flowrate?
Finally I decided to build flowmeters. I did not want to introduce additional large pressures losses. These would be generated by putting a "sensing" fan in the pipes.
A bluff body introduces alternating pressure signals after it. The frequency of the alternation is approximately linear to the volume flow rate.
I found a very cheap sensor for these pressure signals: Simple electret microphones.
I had a few drain pipes laying around and decided to built a test-rig by glueing a ventilator to it:
The bluff body is just a small stripe cut from a copper cladded PCB:
I put 2 microphones on the back-side (downstream) of the bluff body:
And wired them to a small breadboard circuit:
Why I used 2 microphones? A microphone will pickup each sound and not only the vortex signal. Especially vibrations of the pipe can be seen very well and can get larger as the actual signal.
When using 2 microphones, the output signals can be substracted. As the dynamic pressure signal has a different sign on each side of the bluff body, this will increase the actual vortex signal amplitude. Signals that have the same phase on the 2 microphones will be canceled out by substraction.
Here a output signal of the circuit when the ventilator is running:
The upper signal is the output of a single microphone. As it can be seen, the vibration of the pipe generates a high frequency component. The lower signal is the difference signal of the 2 microphones. The pipe vibrations are not present anymore.
This measurement principle works very well, even with low flowrates. The lowest visible flow was 10m^3/h on a DN125 pipe.
Next steps: Build a circuit to measure the vortex frequency, calibration, etc... ]]>dielectric absorption
http://www.xyphro.de/blog/index.php?entry=entry121104-191328
Basically it is an effect that each capacitor has. Depending on the dielectricum it is larger or smaller.
When a capacitor is discharged the capacitor charges up again after removing the shortcut between the 2 terminals.
Of course I had to test it myself :-)
My test setup:
The device under test is a 220µF SMD Tantal capacitor from a junkbox.
I connected a scope (10 MOhm input impedance) to the 2 terminals and charged the capacitor up to 10V.
I discharged the capacitor with a 680 Ohm resistor. As soon as 0V was reached I removed the resistor and watched the scope:
Cool, it really charges up! After a few seconds it looked like this:
So the capacitor charged "itself" to 280mV!
It does not matter how the capacitor is discharged, even a direct shortcut leads to the same result.
Apart from things like piezoelectric effects this is also something that has to be considered in some electronic circuits (e.g. integrators)... ]]>

;)
;)
;)
;)
;)
;)
;)
;)
;)
;)
;)
;)
;)
;)
;)